
This article explains various graphs (data) you can see after logging into the L&Z portal.
When you log in and click on to the Direct Debit tab at the top of the screen:
You will be presented with the following Graphs:
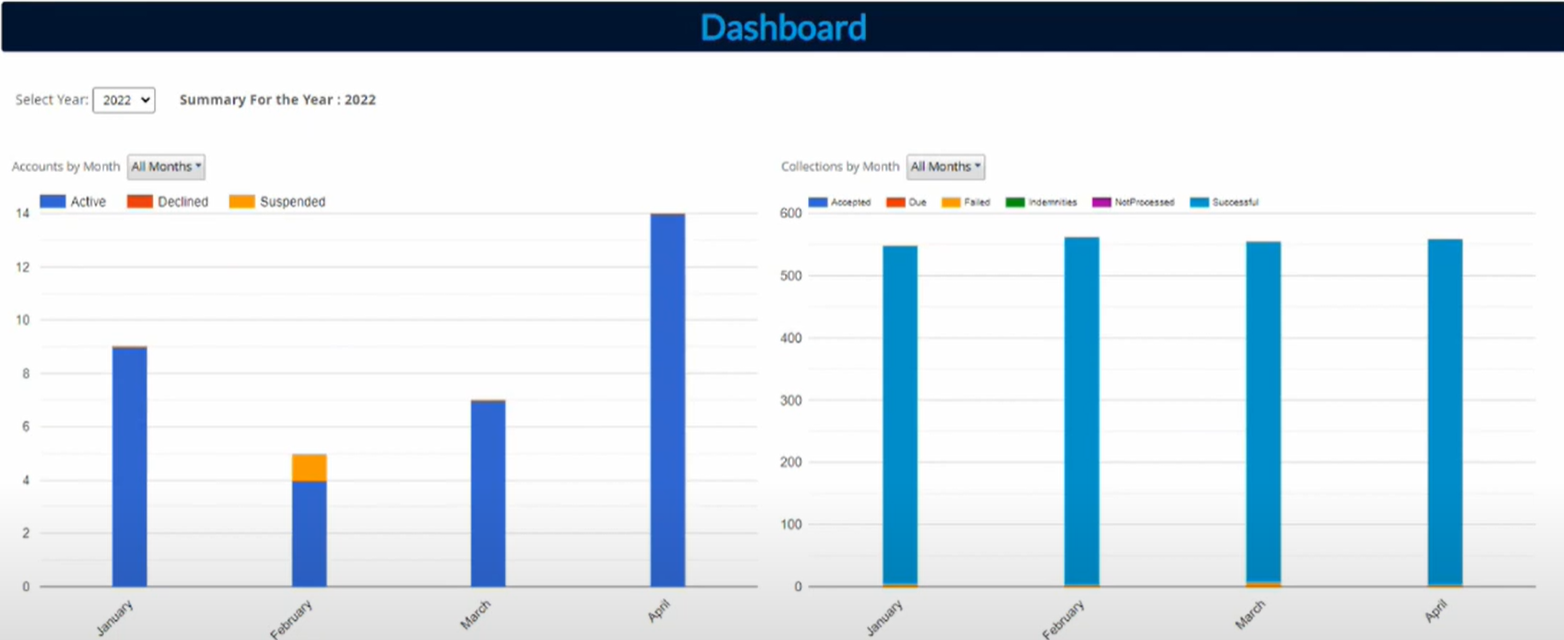
The Graph on the left will advise of the number of customers that you currently have active, suspended, or have been declined this will adjust and grow by each month.
The Graph on the right will show your collections by each month and is colour coded to show what has been successful, failed, Due, Not processed and will also advise of any Indemnities during the month as well.
For both Graphs you can hover your mouse over each column which would give you the count of that period. This can be very handy if you need to have a quick very how many collections L&Z have been making for you and how many have failed as well.
If you have any further questions, please do not hesitate to contact customer.services@landz.co.uk