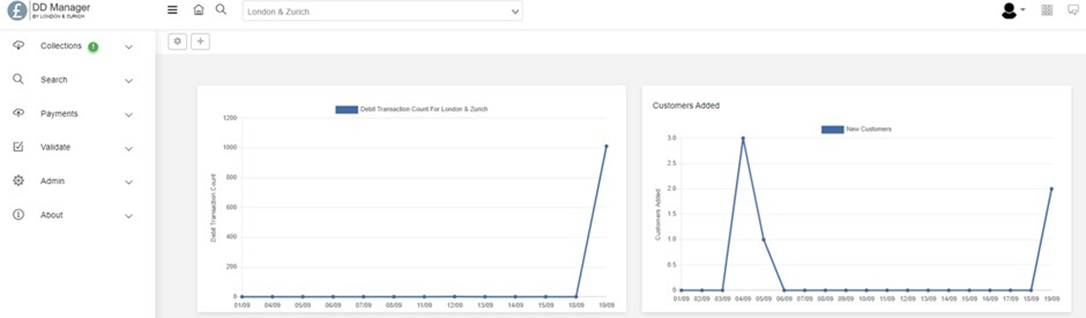
The first screen you will see once you are logged in is a blank dashboard with a drop down on the left hand side. This shows the available sections of the system.
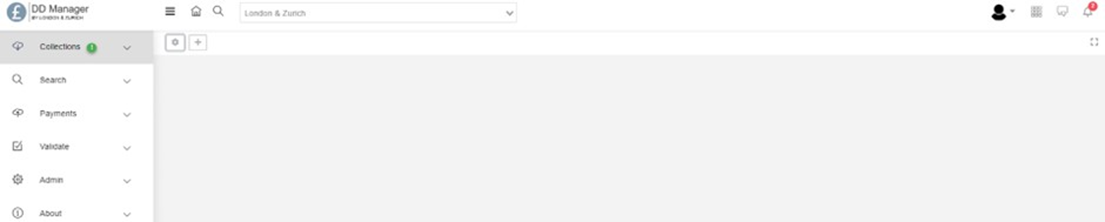
Click the cog icon under your company name.

On the right had side of the screen, you will then see widgets that you can add to your dashboard.
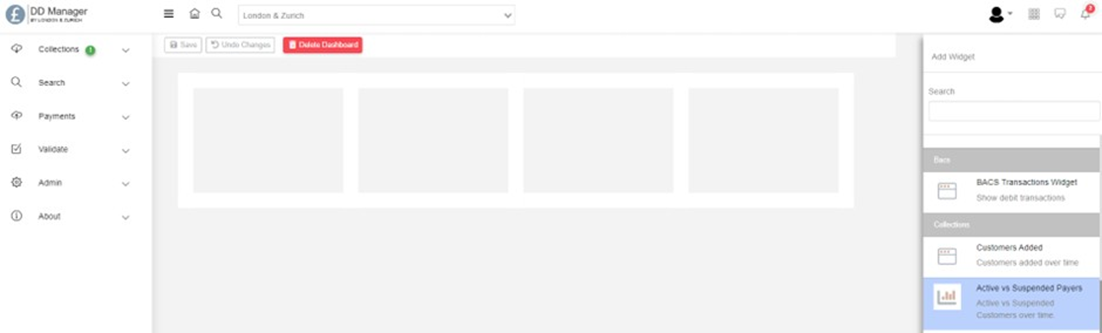
Click and drag across the widgets you would like to appear in your dashboard. Once you have added the required widgets. Click ‘save’ and they will appear and remain on your dashboard. You are able to change and delete any of the widgets as and when required.